Rice, a staple food for over half the world's population, finds its largest consumption in Asia, Sub-Saharan Africa, and South America. The predominant global rice variety, Oryza sativa, is a grass family (Graminaceae) plant species believed to have originated in Asia. Despite its widespread cultivation, economically viable rice production necessitates specific physical requirements. These include high daytime temperatures coupled with cooler nights during the growing season, an abundant and controlled water supply, a level land surface facilitating uniform flooding and drainage, and a subsoil hard-pan layer that inhibits water percolation through the rice bed. This unique combination of factors restricts commercially sound rice cultivation to select geographical areas worldwide.
| Type of Rice | Where is it grown | % of global rice trade |
| Indica | Tropical and subtropical regions such as India, Pakistan, Thailand, Vietnam, Burma, Cambodia, the Philippines, Indonesia, Malaysia, southern China, and Brazil | 62–66% |
| Aromatic (jasmine and basmati) | Primarily Thailand, Vietnam, Cambodia, India, and Pakistan | 23–25% |
| Japonica | Regions with cooler climates such as Japan, North Korea, South Korea, certain regions of China, California, the European Union, Russia, Australia, and Egypt | 9–10% |
| Glutinous and other specialty rice types | Primarily Thailand, Vietnam, Cambodia, and Laos | 2–3% |
The rice market is currently valued at USD 400 billion, expected to increase at a compound annual growth rate (CAGR) of 7.71% between 2023 and 2028. Asia-Pacific is the largest rice market. This is attributable to higher per capita consumption, production, and regional population. Most of the rice is grown and consumed in the Asian region, from Japan in the east to Pakistan in the west. Rice is the second-most vital cereal crop, after wheat, in Asia. It is a crop that ensures food security in many developing countries of Southeast Asian as well as East Asia regions. Over recent years, the rice market has witnessed considerable growth due to the growing demand for rice in emerging and developing nations globally.
Global Rice Production and Consumption
Globally, the top rice-producing country is China, followed by India.
| Top 11 rice - countries, 2018/19–22/23 | |||
| Country | Annual average production, milled basis (million tons) |
Annual average consumption, milled basis (million tons) |
Surplus/Deficit milled basis (million tons) |
| China | 147.69 | 153.68 | (5.99) |
| India | 125.04 | 109.17 | 15.87 |
| Bangladesh | 35.51 | 36.73 | (1.22) |
| Indonesia | 34.36 | 35.37 | (1.01) |
| Vietnam | 27.10 | 21.45 | 5.65 |
| Thailand | 19.53 | 12.70 | 6.83 |
| Burna | 12.53 | 10.37 | 2.16 |
| Philippines | 12.25 | 15.40 | (3.15) |
| Japan | 7.59 | 8.18 | (0.59) |
| Pakistan |
7.53 | 3.70 | 3.83 |
| Nigeria |
5.00 | 7.33 | (2.33) |
Global Rice Trade
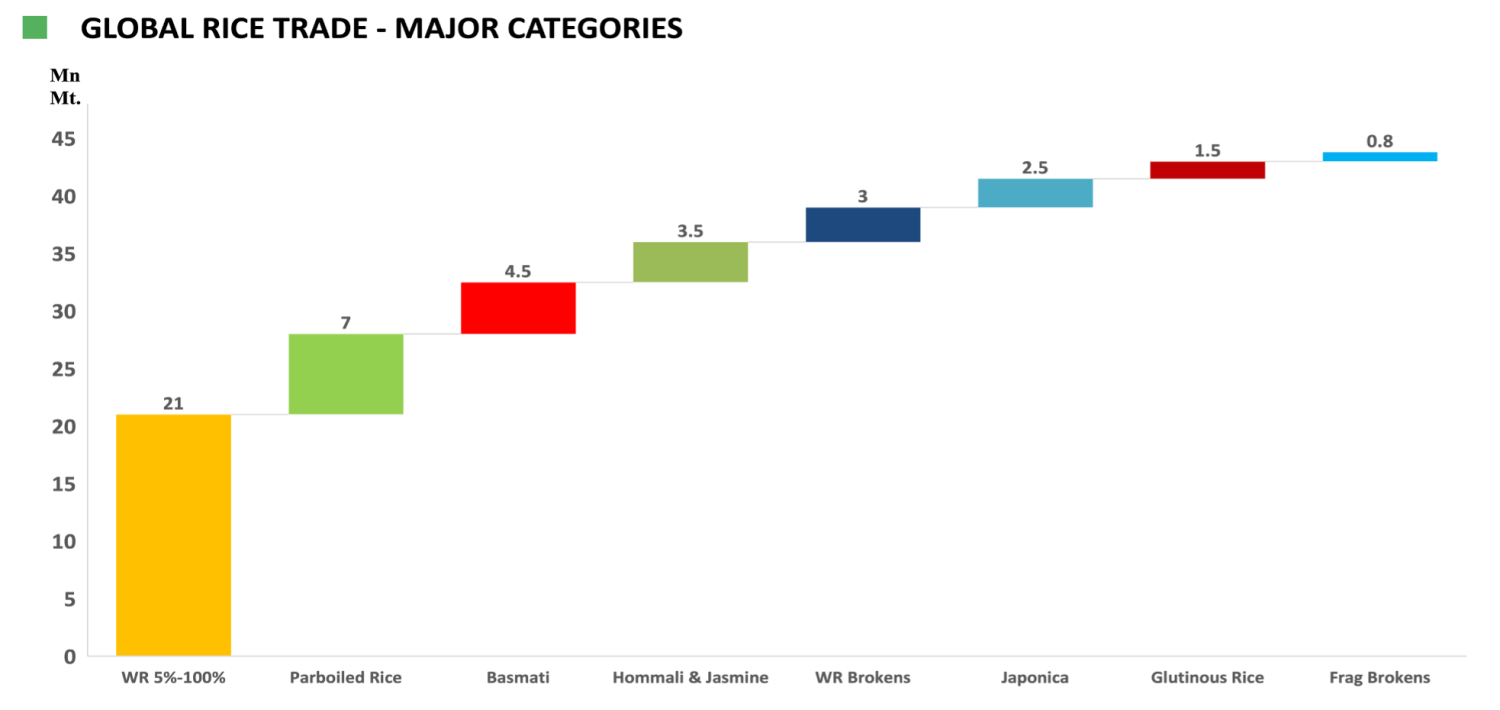
Rice Exports
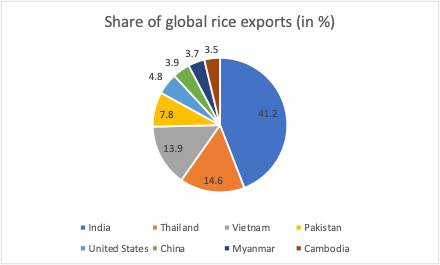
Since 2012, India has been the largest global rice exporter, currently shipping more rice annually than the combined shipments of the next three largest exporters. India’s rice exports increased by almost 49 percent in 2020 and then rose 46 percent more in 2021 to more than 21 million tons before peaking in 2022 at 22.1 million. India’s exports are projected to decline in 2023 and 2024 due to Government imposed export restrictions. The next largest rice exporters are Thailand, Vietnam, Pakistan, the United States, China, Myanmar, and Cambodia, which, along with India, account for a combined 90 percent of the global rice trade. Cambodia started increasing exports in 2009 and are currently near-record high. China substantially increased its exports in 2017 and returned as a major exporter in 2018, although shipments have recently declined. In contrast, U.S. rice exports dropped by 26 percent in 2022 due to a small crop and uncompetitive prices. Thailand’s exports dropped substantially in 2019 and 2020, and despite some expansion, have remained well below past levels. Pakistan’s exports dropped 20 percent in 2023 due to severe flooding in the summer of 2022.
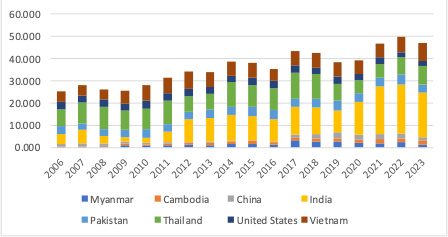
| Country | 2008 | 2009 | 2010 | 2011 | 2012 | 2013 | 2014 | 2015 | 2016 | 2017 | 2018 | 2019 | 2020 | 2021 | 2022 | 2023 | 2024 |
| Total Global | 29,721 | 29,510 | 31,882 | 36,484 | 40,008 | 39,490 | 44,454 | 43,026 | 40,533 | 48,722 | 48,256 | 43,923 | 45,369 | 52,178 | 56,100 | 52,723 | 53,338 |
| India | 3,383 | 2,149 | 2,228 | 4,637 | 10,250 | 10,480 | 11,588 | 11,046 | 10,062 | 12,573 | 11,791 | 9,813 | 14,577 | 21,240 | 22,122 | 17,733 | 16,500 |
| Thailand | 10,011 | 8,570 | 9,047 | 10,647 | 6,945 | 6,722 | 10,969 | 9,779 | 9,891 | 11,658 | 11,213 | 7,565 | 5,715 | 6,283 | 7,682 | 8,736 | 8,400 |
| Vietnam | 4,649 | 5,950 | 6,734 | 7,000 | 7,717 | 6,700 | 6,325 | 6,606 | 5,088 | 6,488 | 6,590 | 6,581 | 6,167 | 6,272 | 7,054 | 8,225 | 7,800 |
| Pakistan | 3,050 | 3,187 | 4,000 | 3,414 | 3,399 | 4,126 | 3,700 | 4,000 | 4,100 | 3,647 | 3,913 | 4,550 | 3,934 | 3,928 | 4,525 | 4,503 | 5,500 |
| United States | 3,267 | 3,017 | 3,868 | 3,246 | 3,298 | 3,295 | 2,947 | 3,381 | 3,343 | 3,349 | 2,776 | 3,142 | 2,857 | 2,950 | 2,191 | 2,357 | 2,825 |
| China | 969 | 783 | 619 | 487 | 267 | 447 | 393 | 262 | 368 | 1,173 | 2,059 | 2,720 | 2,265 | 2,407 | 2,172 | 1,602 | 2,200 |
| Cambodia | 315 | 820 | 750 | 860 | 900 | 1,075 | 1,000 | 1,150 | 1,050 | 1,150 | 1,300 | 1,350 | 1,350 | 1,850 | 1,700 | 1,900 | 2,150 |
| Myanmar | 541 | 1,052 | 700 | 1,075 | 1,357 | 1,163 | 1,688 | 1,735 | 1,300 | 3,350 | 2,750 | 2,700 | 2,300 | 1,900 | 2,335 | 1,577 | 1,800 |
| Brazil | 511 | 591 | 430 | 1,296 | 1,105 | 830 | 852 | 895 | 641 | 594 | 1,245 | 954 | 1,240 | 782 | 1,445 | 1,208 | 1,300 |
| Uruguay | 742 | 926 | 808 | 841 | 1,056 | 939 | 957 | 718 | 996 | 982 | 802 | 809 | 969 | 704 | 982 | 1,003 | 950 |
| Paraguay | 69 | 123 | 135 | 208 | 262 | 365 | 380 | 371 | 556 | 538 | 653 | 689 | 803 | 640 | 752 | 857 | 780 |
| Guyana | 182 | 241 | 298 | 260 | 265 | 346 | 446 | 513 | 478 | 516 | 448 | 511 | 552 | 406 | 338 | 399 | 440 |
| Argentina | 408 | 594 | 468 | 732 | 608 | 526 | 494 | 310 | 527 | 391 | 375 | 388 | 335 | 400 | 402 | 293 | 375 |
| European Union | 152 | 146 | 278 | 237 | 194 | 203 | 284 | 251 | 270 | 570 | 527 | 506 | 543 | 412 | 402 | 365 | 360 |
| Australia | 48 | 17 | 54 | 311 | 449 | 460 | 404 | 323 | 165 | 187 | 262 | 134 | 42 | 72 | 207 | 250 | 260 |
| Turkey | 8 | 19 | 52 | 90 | 99 | 8 | 293 | 252 | 321 | 280 | 213 | 202 | 234 | 241 | 227 | 258 | 250 |
| South Africa | 24 | 24 | 31 | 31 | 43 | 56 | 114 | 127 | 145 | 109 | 113 | 111 | 120 | 121 | 145 | 159 | 160 |
| Taiwan | 34 | 1 | 1 | 11 | 13 | 11 | 19 | 75 | 102 | 20 | 57 | 91 | 224 | 192 | 141 | 129 | 150 |
| Japan | 146 | 193 | 161 | 104 | 217 | 107 | 63 | 65 | 50 | 50 | 60 | 67 | 40 | 110 | 115 | 120 | 120 |
| South Korea | 0 | 4 | 9 | 4 | 2 | 2 | 2 | 2 | 2 | 4 | 64 | 53 | 55 | 52 | 55 | 61 | 100 |
| Malaysia | 1 | 1 | 1 | 1 | 0 | 11 | 37 | 73 | 45 | 1 | 20 | 30 | 30 | 100 | 114 | 123 | 100 |
| Russia | 21 | 90 | 154 | 162 | 314 | 140 | 187 | 163 | 198 | 175 | 139 | 154 | 127 | 121 | 100 | 100 | 100 |
| Suriname | 41 | 42 | 78 | 42 | 62 | 63 | 87 | 90 | 109 | 90 | 95 | 100 | 100 | 105 | 110 | 110 | 100 |
| Guinea | 0 | 50 | 50 | 80 | 80 | 80 | 100 | 50 | 80 | 80 | 80 | 100 | 100 | 80 | 80 | 80 | 80 |
| Kazakhstan | 25 | 6 | 43 | 62 | 47 | 50 | 52 | 66 | 65 | 95 | 95 | 88 | 99 | 118 | 101 | 108 | 80 |
| Colombia | 0 | 0 | 0 | 0 | 0 | 0 | 0 | 0 | 0 | 5 | 1 | 1 | 50 | 55 | 60 | 65 | 65 |
| Cote d'Ivoire | 0 | 0 | 14 | 28 | 27 | 35 | 40 | 50 | 70 | 70 | 80 | 100 | 50 | 25 | 20 | 21 | 50 |
| Laos | 0 | 13 | 22 | 9 | 19 | 16 | 18 | 60 | 64 | 71 | 84 | 81 | 94 | 50 | 100 | 40 | 50 |
| Peru | 20 | 80 | 55 | 50 | 50 | 50 | 70 | 30 | 50 | 100 | 80 | 105 | 70 | 20 | 30 | 50 | 50 |
| Senegal | 0 | 5 | 4 | 23 | 10 | 20 | 10 | 10 | 10 | 10 | 10 | 10 | 20 | 90 | 90 | 80 | 50 |
| Tanzania | 20 | 15 | 20 | 20 | 20 | 55 | 30 | 30 | 30 | 30 | 40 | 30 | 80 | 285 | 115 | 50 | 50 |
| United Kingdom | N/A | N/A | N/A | N/A | N/A | N/A | N/A | N/A | N/A | 61 | 65 | 49 | 62 | 27 | 33 | 30 | 40 |
| Ecuador | 160 | 100 | 100 | 22 | 44 | 14 | 43 | 16 | 1 | 0 | 0 | 29 | 44 | 21 | 45 | 25 | 25 |
| Costa Rica | 11 | 6 | 4 | 6 | 4 | 4 | 6 | 6 | 8 | 8 | 8 | 13 | 17 | 20 | 21 | 20 | 20 |
| Uganda | 25 | 40 | 35 | 40 | 70 | 70 | 30 | 30 | 0 | 20 | 10 | 10 | 10 | 10 | 10 | 10 | 10 |
| Sri Lanka | 0 | 0 | 10 | 12 | 26 | 5 | 6 | 0 | 5 | 5 | 5 | 5 | 8 | 7 | 7 | 8 | 8 |
| Egypt | 750 | 575 | 570 | 320 | 600 | 700 | 600 | 250 | 200 | 100 | 50 | 20 | 20 | 5 | 5 | 5 | 5 |
| Mexico | 10 | 10 | 4 | 3 | 1 | 2 | 2 | 2 | 2 | 90 | 109 | 12 | 18 | 20 | 5 | 5 | 5 |
| Dominican Republic | 28 | 0 | 0 | 0 | 0 | 0 | 0 | 0 | 8 | 10 | 10 | 10 | 10 | 10 | 10 | 10 | 0 |
| Nicaragua | 0 | 0 | 0 | 0 | 0 | 13 | 5 | 5 | 11 | 8 | 10 | 5 | 6 | 6 | 0 | 0 | 0 |
| Saudi Arabia | 20 | 20 | 20 | 20 | 20 | 0 | 0 | 0 | 0 | 0 | 0 | 0 | 0 | 0 | 0 | 0 | 0 |
| Venezuela | 80 | 30 | 20 | 75 | 125 | 250 | 200 | 180 | 100 | 40 | 20 | 0 | 0 | 0 | 0 | 0 | 0 |
| Others | 0 | 20 | 7 | 18 | 43 | 51 | 13 | 54 | 22 | 24 | 34 | 35 | 32 | 41 | 52 | 48 | 30 |
Quantity in Thousand MT
Global Rice Imports
On the global rice import side, Sub-Saharan Africa remains the largest rice importing region, slightly exceeding total imports by all of Asia and accounting for around 30 percent of global imports. The Middle East remains a large global import market, accounting for more than 70 percent of the region’s rice consumption. Southeast Asia is also an important import market, showing recent growth after years of stagnation as the region’s production expanded. The Philippines is the largest rice importer in Southeast Asia and is currently the largest global importer, importing almost 4 million tons annually. East Asia’s rice imports were boosted in 2021 and 2022 by China’s large purchases but imports for this region have since returned to a more normal level. South Asia is the smallest rice importing region in Asia, although Bangladesh’s imports can rapidly increase after a crop shortfall, as in 2017 and 2018 after a weather-reduced harvest and in 2021, after a weak harvest. Rice imports by South America are projected to expand around 13 percent in 2023, with Brazil accounting for most of the expected increase. From 2012–2022, South American imports were nearly flat due to flat-to-declining consumption in most countries’ growth and near-steady regional production. Both North America and the EU are currently importing record or near-record amounts of rice, although both regions have a low per capita rice consumption compared with Asia and Sub-Saharan Africa. These regions are large markets for Asian aromatic varieties, specialty rices that are high-priced and account for a growing share of global rice trade.
| Country | 2008 | 2009 | 2010 | 2011 | 2012 | 2013 | 2014 | 2015 | 2016 | 2017 | 2018 | 2019 | 2020 | 2021 | 2022 | 2023 | 2024 |
| Total Global | 29,721 | 29,510 | 31,882 | 36,484 | 40,008 | 39,490 | 44,454 | 43,026 | 40,533 | 48,722 | 48,256 | 43,923 | 45,369 | 52,178 | 56,100 | 52,723 | 53,338 |
| Philippines | 2,500 | 2,000 | 2,400 | 1,200 | 1,500 | 1,000 | 1,800 | 2,000 | 800 | 1,200 | 2,500 | 2,900 | 2,450 | 2,950 | 3,800 | 3,900 | 4,100 |
| Indonesia | 350 | 250 | 1,150 | 3,098 | 1,960 | 650 | 1,225 | 1,350 | 1,050 | 350 | 2,350 | 600 | 550 | 650 | 740 | 3,500 | 3,500 |
| China | 295 | 337 | 366 | 575 | 2,900 | 3,500 | 4,450 | 5,150 | 4,600 | 5,900 | 4,500 | 2,800 | 3,200 | 4,921 | 6,155 | 2,597 | 2,300 |
| European Union | 1,526 | 1,393 | 1,235 | 1,496 | 1,313 | 1,375 | 1,556 | 1,786 | 1,816 | 1,591 | 1,633 | 1,799 | 1,999 | 1,862 | 2,492 | 2,169 | 2,300 |
| Iraq | 975 | 1,089 | 1,188 | 1,036 | 1,478 | 1,294 | 1,104 | 1,028 | 1,026 | 1,161 | 1,237 | 1,263 | 972 | 1,315 | 2,124 | 1,845 | 2,000 |
| Nigeria | 1,800 | 2,000 | 2,000 | 2,550 | 3,400 | 2,400 | 3,200 | 2,100 | 2,100 | 2,500 | 2,100 | 1,800 | 1,800 | 2,100 | 2,400 | 2,000 | 2,000 |
| Vietnam | 300 | 500 | 400 | 500 | 100 | 100 | 300 | 400 | 300 | 500 | 500 | 500 | 400 | 1,800 | 1,700 | 1,800 | 1,600 |
| Saudi Arabia | 1,166 | 1,072 | 1,069 | 1,059 | 1,193 | 1,326 | 1,459 | 1,601 | 1,260 | 1,195 | 1,290 | 1,425 | 1,613 | 1,157 | 1,324 | 1,487 | 1,500 |
| Cote d'Ivoire | 800 | 800 | 840 | 935 | 1,265 | 830 | 950 | 1,150 | 1,300 | 1,350 | 1,500 | 1,350 | 1,100 | 1,450 | 1,560 | 1,313 | 1,400 |
| Senegal | 860 | 715 | 685 | 805 | 918 | 902 | 960 | 990 | 980 | 1,100 | 1,100 | 1,000 | 1,050 | 1,250 | 1,500 | 1,300 | 1,400 |
| United States | 651 | 682 | 562 | 621 | 640 | 675 | 755 | 757 | 767 | 787 | 916 | 982 | 1,210 | 978 | 1,315 | 1,360 | 1,400 |
| Malaysia | 1,039 | 1,086 | 907 | 1,076 | 1,006 | 885 | 989 | 1,051 | 823 | 900 | 800 | 1,000 | 1,220 | 1,160 | 1,240 | 1,410 | 1,200 |
| Iran | 1,430 | 1,470 | 1,520 | 1,870 | 1,500 | 2,220 | 1,400 | 1,300 | 1,100 | 1,400 | 1,250 | 1,400 | 1,110 | 880 | 1,250 | 751 | 1,150 |
| South Africa | 650 | 745 | 733 | 885 | 870 | 990 | 910 | 993 | 958 | 1,054 | 1,071 | 944 | 1,000 | 1,000 | 1,034 | 1,221 | 1,100 |
| Bangladesh | 1,658 | 146 | 660 | 1,486 | 53 | 114 | 1,335 | 598 | 35 | 2,400 | 1,400 | 80 | 20 | 2,675 | 950 | 365 | 900 |
| Brazil | 417 | 650 | 778 | 591 | 732 | 712 | 586 | 348 | 712 | 779 | 575 | 691 | 876 | 685 | 826 | 983 | 900 |
| United Arab Emirates | 350 | 400 | 450 | 480 | 520 | 540 | 560 | 580 | 670 | 700 | 775 | 850 | 850 | 775 | 1,025 | 900 | 875 |
| Guinea | 175 | 300 | 320 | 370 | 370 | 360 | 520 | 420 | 650 | 600 | 865 | 530 | 670 | 940 | 850 | 870 | 850 |
| Mexico | 578 | 610 | 593 | 705 | 679 | 749 | 685 | 673 | 708 | 913 | 776 | 740 | 843 | 759 | 796 | 728 | 825 |
| Ghana | 300 | 410 | 320 | 620 | 595 | 725 | 590 | 580 | 700 | 650 | 830 | 900 | 850 | 1,050 | 620 | 810 | 700 |
| Japan | 533 | 750 | 649 | 742 | 650 | 690 | 669 | 688 | 685 | 678 | 670 | 678 | 676 | 662 | 669 | 709 | 685 |
| United Kingdom | 0 | 0 | 0 | 0 | 0 | 0 | 0 | 0 | 0 | 668 | 536 | 587 | 695 | 604 | 638 | 667 | 680 |
| Kenya | 305 | 295 | 280 | 335 | 400 | 410 | 440 | 450 | 500 | 625 | 600 | 610 | 600 | 620 | 675 | 936 | 650 |
| Mozambique | 300 | 385 | 325 | 360 | 445 | 500 | 590 | 575 | 625 | 710 | 530 | 635 | 655 | 705 | 685 | 740 | 650 |
| Nepal | 70 | 23 | 47 | 64 | 351 | 340 | 520 | 530 | 530 | 560 | 705 | 620 | 980 | 1,260 | 825 | 445 | 600 |
| Yemen | 315 | 329 | 330 | 337 | 420 | 432 | 440 | 525 | 350 | 420 | 530 | 560 | 560 | 570 | 570 | 550 | 575 |
| Burkina Faso | 130 | 180 | 230 | 230 | 260 | 260 | 330 | 350 | 420 | 500 | 550 | 600 | 600 | 600 | 550 | 500 | 525 |
| Afghanistan | 370 | 265 | 166 | 249 | 233 | 200 | 100 | 250 | 340 | 359 | 286 | 212 | 382 | 325 | 519 | 534 | 510 |
| Cameroon | 250 | 300 | 300 | 310 | 450 | 550 | 525 | 500 | 500 | 600 | 400 | 600 | 500 | 600 | 600 | 470 | 500 |
| Ethiopia | N/A | N/A | N/A | N/A | N/A | N/A | N/A | N/A | 300 | 390 | 600 | 520 | 700 | 850 | 950 | 440 | 500 |
| Sierra Leone | 155 | 90 | 75 | 230 | 230 | 255 | 290 | 310 | 220 | 390 | 320 | 330 | 440 | 400 | 470 | 395 | 500 |
| Benin | 150 | 150 | 125 | 165 | 250 | 350 | 350 | 400 | 450 | 550 | 625 | 525 | 525 | 550 | 670 | 450 | 475 |
| Venezuela | 315 | 107 | 327 | 300 | 375 | 500 | 480 | 500 | 400 | 331 | 635 | 512 | 575 | 600 | 450 | 425 | 475 |
| Haiti | 320 | 300 | 337 | 389 | 372 | 416 | 387 | 447 | 431 | 564 | 428 | 470 | 546 | 440 | 412 | 527 | 460 |
| South Korea | 282 | 241 | 320 | 532 | 238 | 580 | 379 | 372 | 313 | 412 | 377 | 297 | 465 | 439 | 430 | 251 | 460 |
| Canada | 365 | 322 | 358 | 328 | 344 | 355 | 361 | 362 | 356 | 356 | 383 | 421 | 477 | 410 | 524 | 472 | 450 |
| Madagascar | 135 | 80 | 130 | 155 | 185 | 460 | 300 | 210 | 218 | 670 | 390 | 440 | 450 | 560 | 680 | 429 | 450 |
| Somalia | 100 | 155 | 120 | 210 | 150 | 160 | 220 | 290 | 350 | 420 | 370 | 450 | 510 | 500 | 610 | 480 | 450 |
| Turkey | 225 | 207 | 412 | 300 | 271 | 234 | 756 | 463 | 481 | 492 | 387 | 486 | 530 | 332 | 478 | 475 | 450 |
| Cuba | 558 | 457 | 498 | 558 | 330 | 413 | 377 | 575 | 546 | 429 | 499 | 457 | 501 | 416 | 456 | 345 | 445 |
| Angola | 260 | 195 | 280 | 275 | 360 | 430 | 500 | 450 | 470 | 450 | 490 | 450 | 500 | 500 | 720 | 325 | 400 |
| Liberia | 170 | 175 | 220 | 205 | 210 | 310 | 300 | 280 | 200 | 370 | 350 | 290 | 375 | 360 | 335 | 330 | 400 |
| Mali | 100 | 100 | 120 | 80 | 150 | 140 | 150 | 180 | 170 | 200 | 250 | 300 | 300 | 300 | 400 | 400 | 400 |
| Singapore | 274 | 246 | 264 | 275 | 247 | 293 | 323 | 288 | 319 | 323 | 287 | 321 | 395 | 381 | 369 | 433 | 375 |
| Egypt | 20 | 20 | 15 | 76 | 292 | 19 | 30 | 36 | 116 | 90 | 230 | 665 | 309 | 326 | 600 | 343 | 350 |
| Tanzania | 100 | 85 | 70 | 80 | 155 | 200 | 185 | 198 | 220 | 260 | 260 | 190 | 150 | 100 | 190 | 480 | 325 |
| Togo | 85 | 115 | 80 | 105 | 90 | 100 | 100 | 90 | 150 | 260 | 280 | 290 | 350 | 260 | 325 | 385 | 325 |
| Congo (Kinshasa) | 35 | 110 | 105 | 115 | 110 | 130 | 110 | 120 | 130 | 150 | 159 | 230 | 253 | 295 | 264 | 230 | 320 |
| Hong Kong | 399 | 397 | 390 | 381 | 415 | 419 | 372 | 332 | 330 | 334 | 326 | 317 | 313 | 289 | 290 | 270 | 310 |
| Niger | 170 | 180 | 260 | 245 | 275 | 280 | 300 | 250 | 250 | 300 | 350 | 360 | 380 | 400 | 300 | 300 | 300 |
| Oman | 350 | 78 | 132 | 179 | 190 | 329 | 280 | 300 | 230 | 220 | 255 | 230 | 250 | 200 | 257 | 297 | 285 |
| Gambia | 105 | 100 | 95 | 120 | 115 | 155 | 185 | 125 | 150 | 180 | 230 | 170 | 225 | 190 | 200 | 270 | 275 |
| Kuwait | 237 | 172 | 179 | 258 | 194 | 220 | 273 | 247 | 211 | 223 | 220 | 252 | 244 | 199 | 200 | 219 | 225 |
| Australia | 204 | 216 | 229 | 160 | 134 | 142 | 155 | 151 | 163 | 164 | 167 | 212 | 276 | 204 | 249 | 221 | 220 |
| Algeria | 95 | 90 | 90 | 85 | 145 | 153 | 135 | 105 | 157 | 154 | 151 | 128 | 140 | 136 | 178 | 225 | 200 |
| Costa Rica | 85 | 86 | 71 | 64 | 84 | 93 | 103 | 107 | 164 | 138 | 138 | 157 | 173 | 150 | 211 | 223 | 200 |
| Russia | 237 | 230 | 240 | 188 | 214 | 233 | 299 | 228 | 211 | 244 | 219 | 237 | 224 | 191 | 236 | 218 | 200 |
| Chile | 123 | 128 | 110 | 108 | 124 | 114 | 110 | 143 | 128 | 164 | 177 | 154 | 198 | 173 | 186 | 206 | 190 |
| Jordan | 135 | 177 | 136 | 140 | 220 | 190 | 200 | 195 | 205 | 220 | 190 | 220 | 230 | 210 | 225 | 180 | 190 |
| Qatar | 0 | 0 | 0 | 110 | 154 | 150 | 224 | 155 | 189 | 216 | 183 | 185 | 227 | 153 | 178 | 190 | 185 |
| Colombia | 30 | 111 | 8 | 150 | 330 | 250 | 325 | 284 | 293 | 112 | 149 | 194 | 237 | 31 | 187 | 113 | 180 |
| Peru | 135 | 81 | 97 | 215 | 263 | 176 | 201 | 258 | 296 | 370 | 277 | 273 | 307 | 205 | 121 | 142 | 160 |
| Israel | 68 | 78 | 75 | 95 | 100 | 91 | 109 | 105 | 116 | 115 | 120 | 126 | 176 | 159 | 137 | 146 | 150 |
| Syria | 230 | 250 | 315 | 250 | 250 | 169 | 192 | 214 | 205 | 165 | 218 | 208 | 182 | 247 | 157 | 122 | 150 |
| Guatemala | 76 | 65 | 60 | 59 | 71 | 55 | 64 | 74 | 102 | 94 | 103 | 101 | 139 | 101 | 148 | 108 | 140 |
| Honduras | 111 | 104 | 94 | 126 | 111 | 90 | 131 | 149 | 191 | 113 | 151 | 130 | 123 | 129 | 151 | 123 | 140 |
| Kazakhstan | 13 | 37 | 17 | 15 | 24 | 20 | 30 | 32 | 29 | 128 | 147 | 156 | 87 | 188 | 188 | 109 | 130 |
| Panama | 70 | 33 | 75 | 47 | 89 | 73 | 46 | 82 | 90 | 60 | 155 | 85 | 105 | 25 | 48 | 150 | 125 |
| North Korea | 30 | 62 | 89 | 108 | 61 | 50 | 70 | 43 | 58 | 129 | 170 | 202 | 50 | 150 | 75 | 164 | 110 |
| Guinea-Bissau | 80 | 75 | 110 | 130 | 130 | 130 | 120 | 120 | 130 | 140 | 130 | 120 | 150 | 120 | 50 | 120 | 100 |
| Jamaica | 85 | 80 | 80 | 90 | 88 | 83 | 82 | 89 | 82 | 88 | 84 | 82 | 57 | 79 | 100 | 100 | 100 |
| Nicaragua | 100 | 77 | 89 | 90 | 81 | 82 | 70 | 70 | 121 | 88 | 91 | 103 | 104 | 109 | 96 | 100 | 100 |
| Switzerland | 79 | 105 | 112 | 121 | 115 | 120 | 127 | 123 | 133 | 119 | 111 | 120 | 123 | 110 | 91 | 82 | 100 |
| Taiwan | 100 | 86 | 146 | 106 | 125 | 110 | 104 | 122 | 119 | 125 | 98 | 110 | 101 | 101 | 119 | 109 | 100 |
| Thailand | 8 | 300 | 300 | 200 | 600 | 500 | 300 | 300 | 300 | 250 | 250 | 250 | 250 | 200 | 50 | 50 | 100 |
| El Salvador | 77 | 85 | 68 | 80 | 74 | 65 | 71 | 65 | 73 | 66 | 76 | 63 | 99 | 78 | 73 | 84 | 80 |
| Libya | 165 | 150 | 225 | 215 | 310 | 300 | 300 | 250 | 200 | 200 | 175 | 190 | 70 | 100 | 30 | 80 | 80 |
| Uzbekistan | 9 | 16 | 1 | 12 | 5 | 0 | 4 | 49 | 2 | 0 | 17 | 28 | 20 | 51 | 68 | 85 | 80 |
| Ukraine | 70 | 81 | 74 | 58 | 52 | 68 | 84 | 83 | 63 | 80 | 95 | 81 | 116 | 82 | 86 | 76 | 75 |
| Morocco | 10 | 15 | 25 | 5 | 30 | 15 | 5 | 5 | 10 | 15 | 35 | 40 | 56 | 48 | 55 | 83 | 70 |
| Laos | 19 | 47 | 30 | 24 | 13 | 6 | 23 | 214 | 228 | 82 | 52 | 200 | 100 | 50 | 50 | 70 | 60 |
| Mauritania | 65 | 130 | 100 | 80 | 85 | 135 | 180 | 70 | 100 | 120 | 100 | 80 | 100 | 100 | 60 | 60 | 60 |
| Mauritius | 70 | 75 | 85 | 55 | 55 | 60 | 62 | 61 | 57 | 55 | 61 | 57 | 66 | 57 | 60 | 59 | 60 |
| New Zealand | 41 | 42 | 43 | 42 | 41 | 42 | 46 | 45 | 46 | 49 | 52 | 53 | 61 | 53 | 54 | 58 | 60 |
| Cambodia | 50 | 50 | 5 | 5 | 10 | 40 | 9 | 10 | 8 | 10 | 12 | 10 | 10 | 30 | 69 | 41 | 50 |
| Ecuador | 20 | 20 | 10 | 10 | 44 | 20 | 0 | 1 | 40 | 100 | 100 | 80 | 100 | 100 | 40 | 50 | 50 |
| Sri Lanka | 110 | 90 | 125 | 27 | 35 | 23 | 599 | 285 | 30 | 748 | 249 | 24 | 16 | 147 | 783 | 30 | 50 |
| Uganda | 60 | 80 | 75 | 95 | 135 | 115 | 100 | 80 | 40 | 100 | 50 | 60 | 80 | 50 | 50 | 50 | 50 |
| Azerbaijan | 8 | 12 | 10 | 12 | 22 | 105 | 75 | 99 | 97 | 37 | 45 | 35 | 39 | 31 | 26 | 20 | 30 |
| Brunei | 36 | 31 | 35 | 40 | 52 | 32 | 54 | 43 | 50 | 41 | 46 | 47 | 38 | 26 | 28 | 21 | 30 |
| Belarus | 8 | 3 | 3 | 14 | 26 | 30 | 31 | 29 | 27 | 30 | 29 | 27 | 30 | 27 | 29 | 25 | 25 |
| Dominican Republic | 20 | 26 | 36 | 18 | 8 | 12 | 17 | 14 | 20 | 42 | 20 | 24 | 38 | 27 | 23 | 38 | 25 |
| Bolivia | 51 | 26 | 12 | 22 | 11 | 46 | 97 | 53 | 40 | 36 | 30 | 8 | 14 | 6 | 8 | 2 | 5 |
| Chad | 14 | 15 | 20 | 10 | 30 | 30 | 5 | 5 | 5 | 10 | 15 | 10 | 5 | 5 | 5 | 5 | 5 |
| Pakistan | 0 | 0 | 18 | 38 | 65 | 45 | 22 | 30 | 10 | 8 | 9 | 7 | 7 | 7 | 5 | 7 | 5 |
| Turkmenistan | 0 | 4 | 34 | 33 | 47 | 33 | 43 | 45 | 27 | 20 | 3 | 5 | 1 | 1 | 9 | 1 | 5 |
| Reunion | 60 | 45 | 25 | 30 | 25 | 25 | 16 | 20 | 25 | 24 | 23 | 24 | 24 | 23 | 35 | 30 | 0 |
| Trinidad and Tobago | 30 | 42 | 26 | 27 | 32 | 27 | 35 | 39 | 23 | 23 | 30 | 30 | 30 | 30 | 30 | 30 | 0 |
| Others | 1,631 | 2,690 | 2,839 | 2,729 | 3,539 | 3,665 | 3,423 | 2,734 | 2,514 | 2,916 | 1,977 | 1,558 | 1,396 | 2,278 | 1,231 | 2,686 | 2,333 |
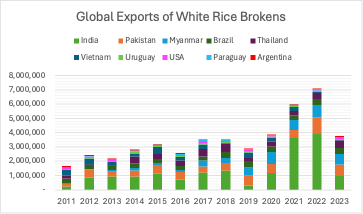
Global White Rice Broken Exports
Global Key Buyers of Broken Rice
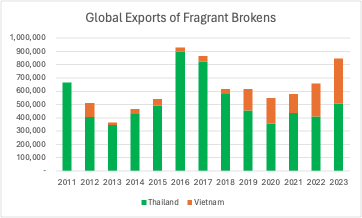
Global Fragrant Brokens Exports
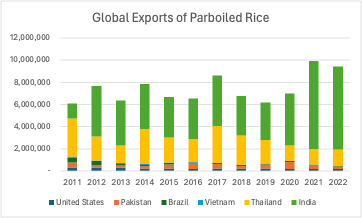
Global Parboiled Rice Exporters
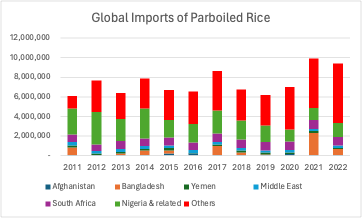
Global Parboiled Rice Importers


